Kano model template
Sort features into must-be, performance, attractive, indifferent and reverse by how they affect customer satisfaction.
Use this templateFree, opens in your browser. No sign-up.
What is the Kano model?
The Kano model, published by Noriaki Kano and colleagues in 1984, sorts product features by how they affect customer satisfaction. Must-be features are expected basics: nobody praises them, but their absence causes frustration. Performance features make customers happier the more you deliver. Attractive features delight people precisely because they don't expect them. The rest either don't matter (indifferent) or annoy some users (reverse).
The template puts the classic satisfaction chart next to the five categories and a table for survey results, filled in for a food delivery app: card payment that just works is a must-be, delivery time is performance, and a live courier map is attractive. Replace the examples with your own features and survey numbers.
What's on the board
- Must-be — expected basics
- Order arrives with every item · Card payment just works · Correct delivery address
- Performance — more is better
- Delivery time · Restaurant choice · Low delivery fee
- Attractive — delights, not expected
- Live courier map · Free dessert on the 10th order · Group ordering
- Indifferent — nobody cares
- Restaurant founding stories · App icon themes
- Reverse — some users dislike it
- Sign-up before browsing · Hourly push offers
Table columns: Feature, A %, O %, M %, I %, R %, Category.
Also on the board
- Customer satisfied
- Attractive
- Performance
- Fully implemented →
- Not implemented
- Must-be
- Customer dissatisfied
- Survey results (n = 412)
- A attractive · O one-dimensional (performance) · M must-be · I indifferent · R reverse
How to fill in the Kano model template
- Click Use this template. It opens in the Kelvo app as a new board, saved in your browser. Double-click any box to change its text.
- List 10 to 20 candidate features. Write each one from the customer's side (“See where my courier is”) and add it as a row in the survey table.
- Ask the two Kano questions. For every feature, ask customers how they'd feel if it were there and how they'd feel if it weren't, each answered with: I like it, I expect it, I'm neutral, I can tolerate it, or I dislike it.
- Classify each pair of answers. Map every pair to A, O, M, I or R (attractive, one-dimensional, must-be, indifferent, reverse) with the standard Kano evaluation table, and enter the percentages in the table's columns.
- Move each sticky to its category. The category with the largest share wins. When two are close, note it: the feature splits your audience, and segmenting the results may explain why.
- Plan in Kano order. Cover every must-be first, invest in the performance features customers care about most, add one or two attractive ones to stand out, and drop the indifferent and reverse ones.
When to use it
- Deciding what belongs in a first release and what can wait
- Your roadmap is all performance improvements and nothing that delights
- You need evidence for why an unglamorous basic beats a flashy feature
- Designing a customer survey about a set of candidate features
When to skip it
- Internal tools or back-end work with no direct users, where satisfaction isn't the measure
- Ranking features of very different cost: Kano ignores effort, so pair it with RICE or an impact/effort matrix
Working on a product board in Kelvo
- Add notes fast
- Press S for a sticky note in the middle of your view. A sticky is a box like any other: link it, recolour it, resize it.
- Paste a table
- Paste comma- or tab-separated text and it becomes a table. Tab moves to the next cell and adds rows as you go.
Questions
What are the five Kano categories?
Must-be (basic expectations), performance or one-dimensional (more is better), attractive (unexpected delighters), indifferent (no effect on satisfaction) and reverse (some customers would rather not have it). Survey analysis also uses questionable for contradictory answers.
How do you run a Kano survey?
For each feature ask a functional question (“How would you feel if the app had X?”) and a dysfunctional one (“How would you feel if it didn't?”), with five answers from “I like it” to “I dislike it”. Each pair of answers maps to a category through the Kano evaluation table; count the categories per feature.
Do Kano categories change over time?
Yes. Delighters turn into expectations once competitors copy them: a live courier map was attractive in food delivery once and is close to a must-be today. Re-run the survey for important features every year or so.
Kano model or RICE: which should I use?
They answer different questions. Kano tells you how customers will feel about a feature; RICE ranks work by reach, impact, confidence and effort. Many teams use Kano to understand features, then RICE to decide the order.
Related templates
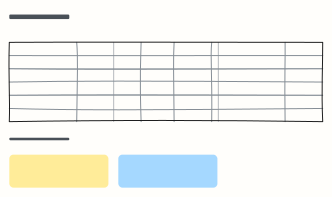 RICE prioritization
Score features by Reach, Impact, Confidence and Effort to rank a backlog with numbers instead of opinions.
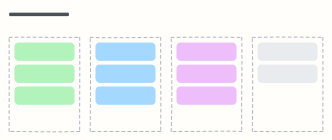 Now / Next / Later roadmap
An outcome-based product roadmap without fake dates: what we're doing now, next, later, and what we're not doing.
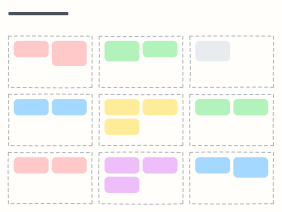 PRD one-pager
A product requirements doc on one board: problem, goals, non-goals, users, requirements, metrics, risks and timeline.
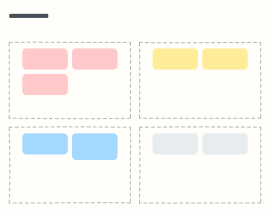 MoSCoW prioritization
Split a release's scope into Must, Should, Could and Won't-have-this-time so everyone agrees what ships.
 Tech debt prioritization
Sort tech debt by impact and effort so the team fixes quick wins first and plans the big ones.
 Product backlog
A ranked backlog with type, estimate and readiness, plus backlog health and the next refinement session.