Observability stack template
Metrics, logs and traces through OpenTelemetry into Prometheus, Loki and Tempo, with Grafana, alerting and SLO notes.
Use this templateFree, opens in your browser. No sign-up.
What's on the board
- Golden signals
- Latency (p50, p95, p99) · Traffic (requests / s) · Errors (5xx rate) · Saturation (CPU, memory, queue depth)
- SLOs & alerting
- 99.9% availability = 43 min / month error budget · Alert on burn rate, not every spike · Every alert links to a runbook
Also on the board
- Metrics: Prometheus
- Alertmanager
- PagerDuty / Slack on-call
- Services, Kubernetes, databases
- OpenTelemetry Collector
- Logs: Loki / Elasticsearch
- Grafana dashboards
- Traces: Tempo / Jaeger
How to use this template
- Click Use this template. It opens in the Kelvo app as a new board, saved in your browser.
- Double-click any box to change its text. Replace the examples with your own content.
- Link by dragging. Hover a box and drag one of its dots onto another box. The whole box is the target, and links stay attached when you move things.
- Sketch, then convert. Draw boxes and arrows with the pen, select the strokes and click Convert sketch: they become real boxes and links.
- Group by environment or region. Draw a frame (F) around a group of services; moving the frame moves everything inside it.
Good for
- observability
- monitoring
- sre
- devops
- opentelemetry
- Design reviews and architecture decision meetings
- Runbooks and onboarding for on-call engineers
- Planning a migration or a cost-cutting pass
Related templates
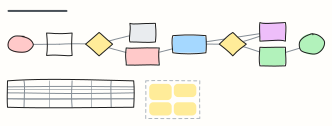 On-call incident runbook
What the on-call engineer does when a page fires: acknowledge, judge impact, declare, mitigate first, then escalate and follow up.
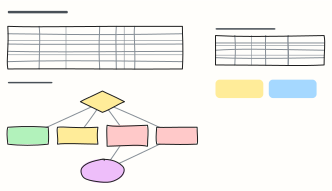 SLOs & error budget policy
Define SLIs and SLOs per service, turn them into an error budget, and agree what happens to releases as the budget burns.
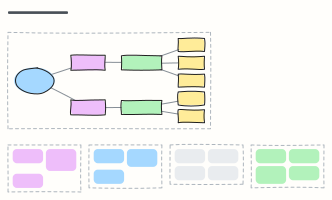 Kubernetes cluster overview
Ingress, services, deployments and pods in a namespace, with config, storage, control plane and add-ons around them.
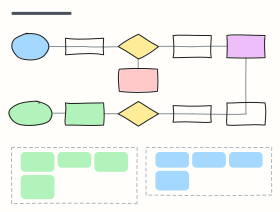 CI/CD pipeline with quality gates
From pull request to production: build, tests, security scans, staging, approval and canary release, with the gates in between.
 Incident response
Detect, triage, mitigate, communicate, resolve and learn — an on-call runbook in one view.
 Incident postmortem
A blameless postmortem: summary, timeline, five whys to the root cause, what went well or wrong, and owned actions.